
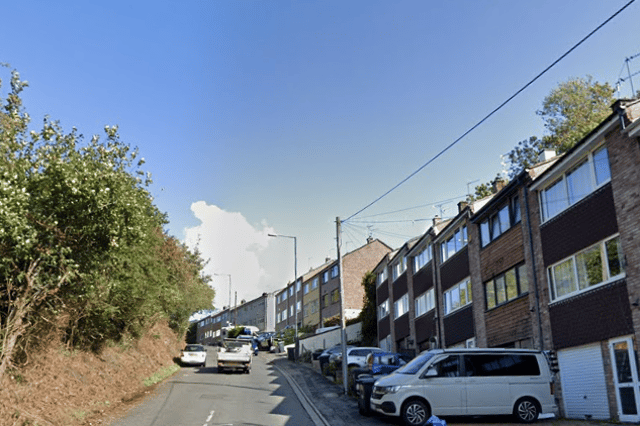

The rankings have been determined using the latest data available for a 12 month period at https://www.police.uk/ (i.e. May 2024 to April 2025).
Scroll through to learn about the 17 safest neighbourhoods in Bristol, according to the latest crime data, and their most common offences.
All photos are for illustrative purposes only and figures do not refer to any individual buildings or streets.
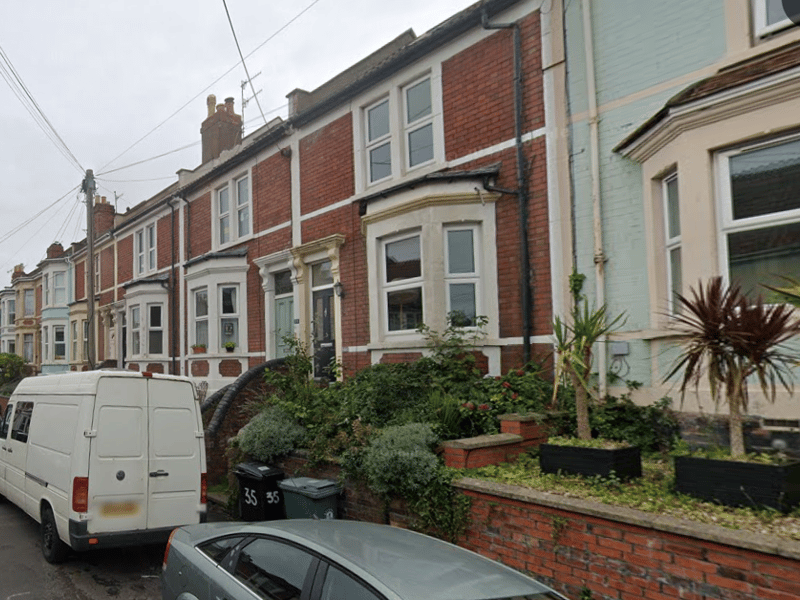
9. Windmill
There were 1,058 offences in Windmill between May 2024 and April 2025. The most common offence was 'violence and sexual offences', with 395 in total. | Google Maps
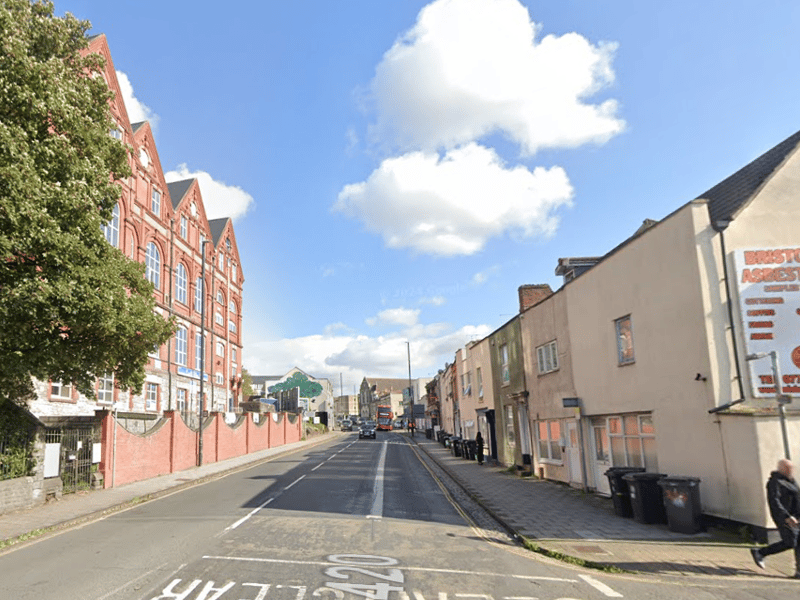
10. St George West
There were 1,085 offences in St George West between May 2024 and April 2025. The most common offence was 'violence and sexual offences', with 349 in total. | Google Maps

11. Bishopston
There were 1,115 offences in Bishopston between May 2024 and April 2025. The most common offence was 'violence and sexual offences', with 447 in total. | Google Photo: Google
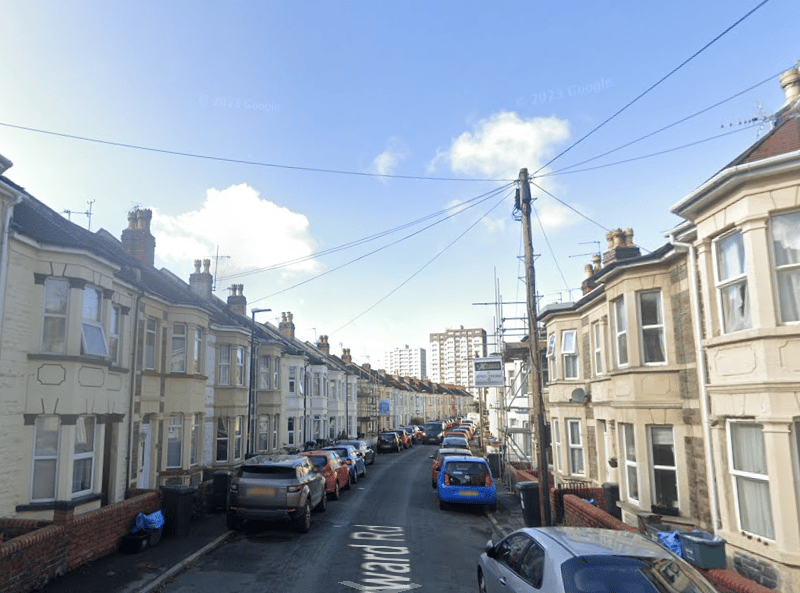
12. Barton Hill
There were 1,165 offences in Barton Hill between May 2024 and April 2025. The most common offence was 'violence and sexual offences', with 406 in total. | Google Maps