
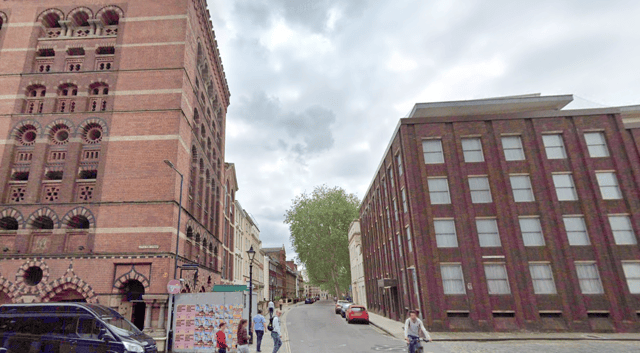

The rankings have been determined using the latest data available for a 12 month period on https://www.police.uk/ (i.e. September 2024 to August 2025).
Scroll through to learn about Bristol's 19 neighbourhoods with the highest crime rates in the past year.
All photos are for illustrative purposes only and figures do not refer to any individual buildings or streets.
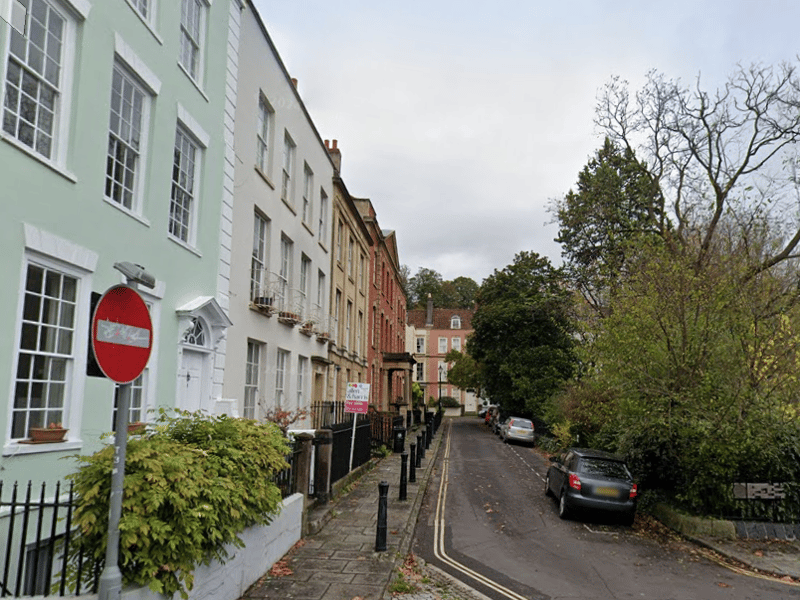
9. Harbourside and Hotwells
2,097 criminal offences reported between September 2024 and August 2025. | Google Maps
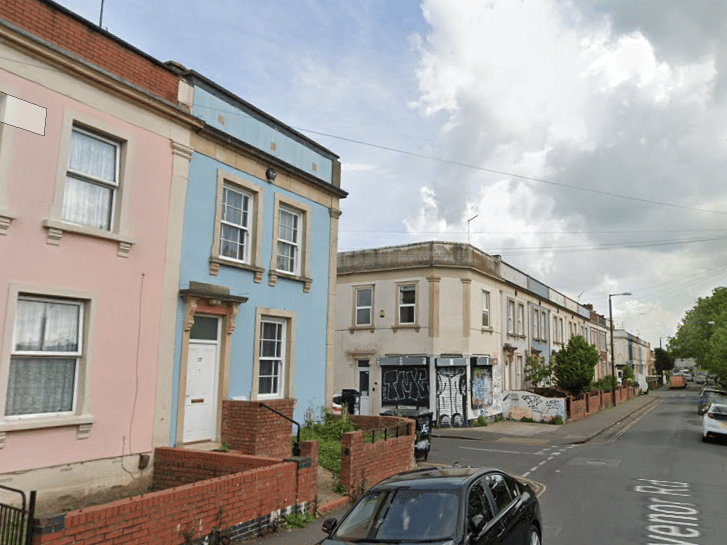
10. St Pauls
2,071 criminal offences reported between September 2024 and August 2025. | Google Maps
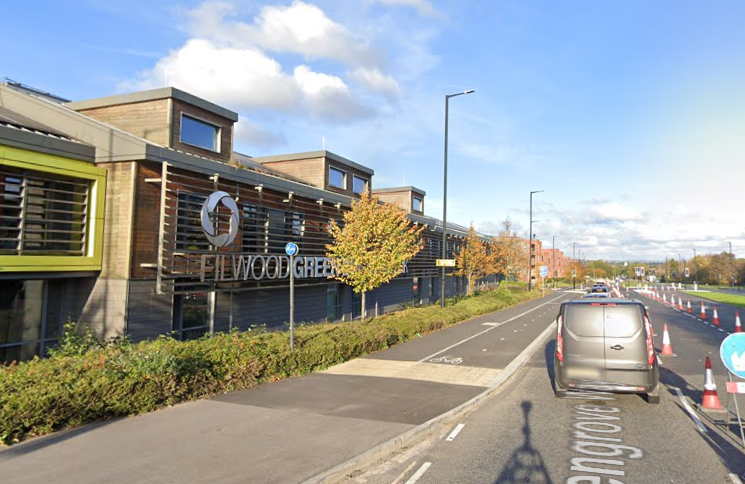
11. Filwood
2,010 criminal offences reported between September 2024 and August 2025. | Google Maps
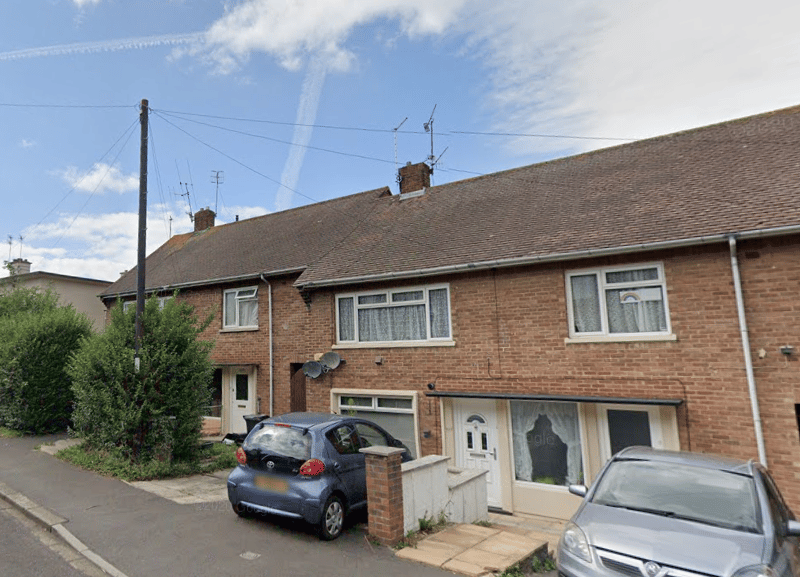
12. Kingsweston
1,905 criminal offences reported between September 2024 and August 2025. | Google Maps
3 / 5