
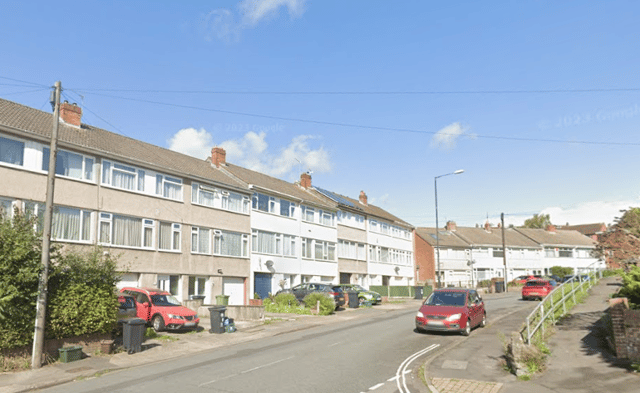

The rankings have been determined using the latest data available from the police.uk website, from February 2024 to January 2025.
The website includes a breakdown of the type of offences that were reported and a monthly breakdown of the overall amount of crimes reported.
Scroll through to learn about the 16 Bristol neighbourhoods with the lowest crime rates and their most common type of crime.
All photo as for illustrative purposes only and figures to not refer to any individual buildings or streets.
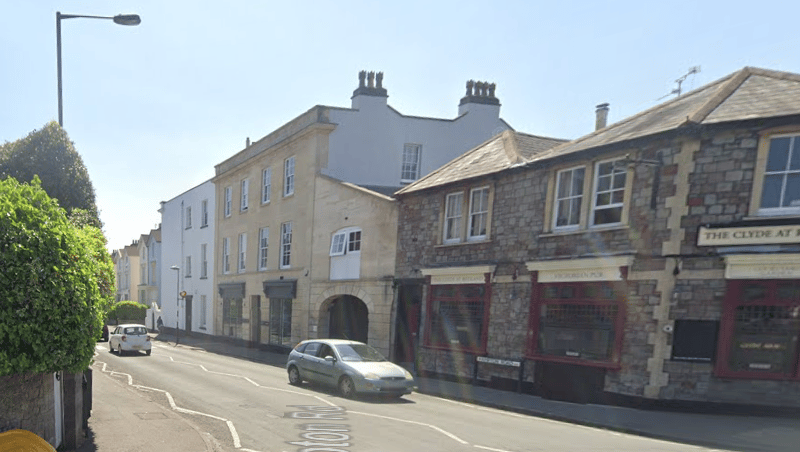
5. Redland
Redland had 863 reported crimes between February 2024 and January 2025. The most common crime was 'violence and sexual offences' (257) | Google Maps
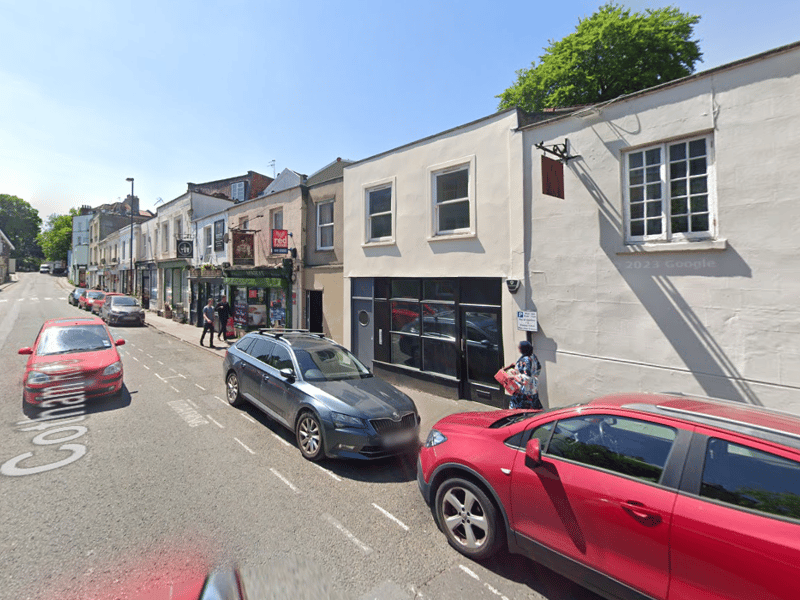
6. Cotham
Cotham had 869 reported crimes between February 2024 and January 2025. The most common crime was 'violence and sexual offences' (322) | Google Maps Photo: Google Maps
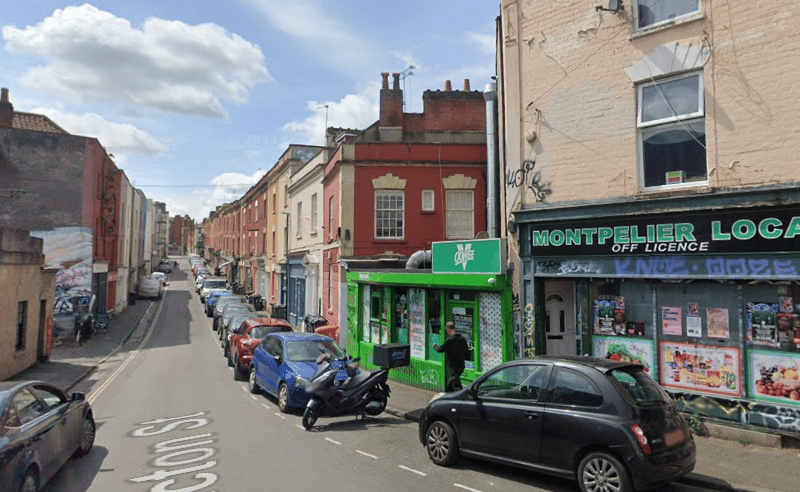
7. Montpelier and St Werburghs
Montpelier and St Werburghs had 995 reported crimes between February 2024 and January 2025. The most common crime was 'violence and sexual offences' (300) | Google Maps
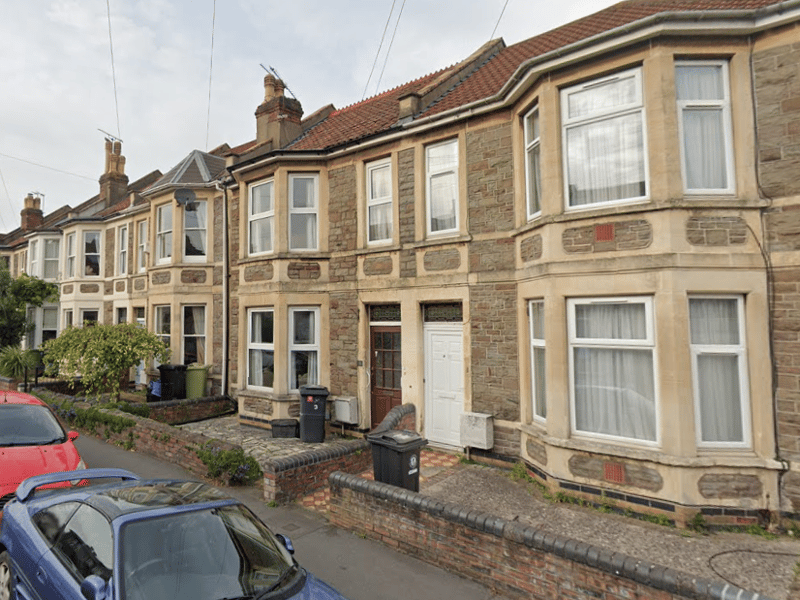
8. Bishopston
Bishopston had 1,066 reported crimes between February 2024 and January 2025. The most common crime was 'violence and sexual offences' (452) | Google Maps