Bristol Clean Air Zone: Council reveals the 28 city locations pollution exceeded legal limit

and live on Freeview channel 276
Twenty-eight locations across Bristol exceeded the legal limit for Nitrogen dioxide emissions last year as the city plans to introduce Clean Air Zones (CAZ).
Bristol will begin to implement CAZ on November 28 after been directed to by the Government to improve air quality.
Advertisement
Hide AdAdvertisement
Hide AdThe aim is to reduce harmful and illegal levels of pollution which may result in fines for drivers with older or other ‘non-compliant’ vehicles.
These vehicles will have to pay a daily charge to drive into the zone, a central area of Bristol where pollution regularly exceeds legal levels.
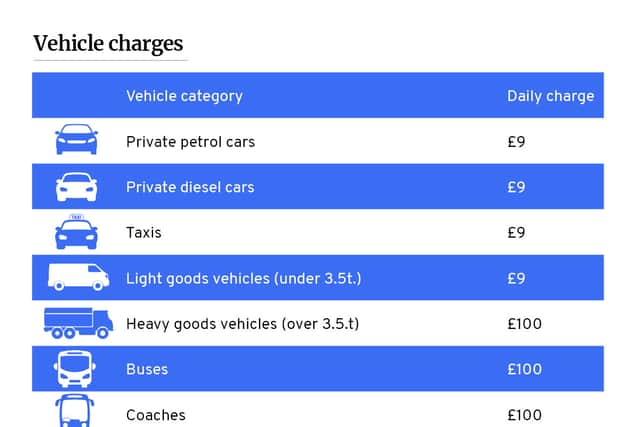

Bristol City Council will be tasked with deciding where the zones will be implemented and whether or not certain zones could land drivers with fines, with the amounts ranging from £8 to £1,000.
In an update on the Clean Air Zone, the council explained why the zone was needed. It said 28 locations in the city had exceeded the legal limit for Nitrogen dioxide in 2021, adding that air pollution caused 36,000 premature deaths in the UK each year.
Advertisement
Hide AdAdvertisement
Hide AdFive of the 28 locations exeeding the legal limit were based in Bedminster, including Bedminster Rd, Bedminster Parade and Bedminster Down.
Elsewhere, Colston Avenue scored the highest amout of Nitrogen dioxide - 58.030 μg/m3.
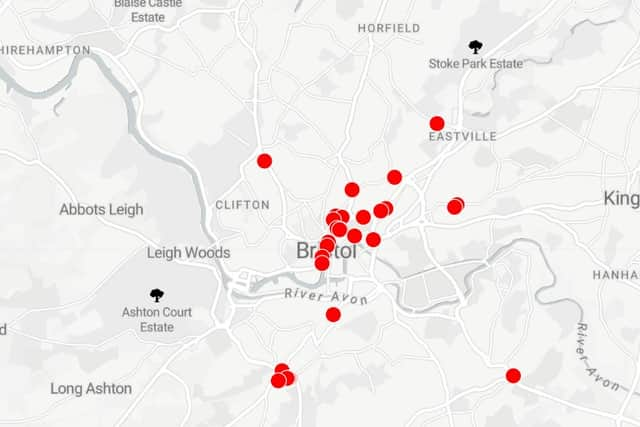
The full list can be found here (some roads have more than one test location):
Colston Avenue, city centre - 58.030 μg/m3
Newfoundland Way, city centre - 52.992 μg/m3
Parson Street, city centre - 51.365 μg/m3
Rupert Street, outside fire station, city centre - 49.953 μg/m3
Advertisement
Hide AdAdvertisement
Hide AdBedminster Road, opposite Van Sales, city centre - 49.700 μg/m3
Malborough Street, city centre - 47.885 μg/m3
Galleries, city centre - 46.522 μg/m3
Bedminster Down Road, Bedminster - 45.915 μg/m3
Bedminster Road, Bedminster - 45.384 μg/m3
Muller Road/Glenfrome Road, Eastville - 44.825 μg/m3
Ashley Road, Monteplier - 44.536 μg/m3
Blackboy Hill, Clifton - 44.420 μg/m3
Newfoundland Way, city centre - 43.976 μg/m3
A4044 Rounabout, city centre - 43.845 μg/m3
College Green, city centre - 43.557 μg/m3
Anchor Road, city centre - 43.292 μg/m3
Lewins Mead, city centre - 43.031 μg/m3
Bedminster Road, Bedminster - 42.988 μg/m3
Malborough Street, city centre - 42.330 μg/m3
Rupert Street, city centre - 42.269 μg/m3
Whitehall Road, Whitehall - 41.517 μg/m3
Top of Brislington Hill, Brislington - 41.428 μg/m3
Bedminster Parade, Bedminster - 41.037 μg/m3
Malborough Street, city centre - 40.820 μg/m3
Newfoundland Street, city centre - 40.583 μg/m3
Whitehall Road, Whitehall - 40.408 μg/m3
Stokes Croft - 40.287 μg/m3
Colston Avenue, city centre - 40.098 μg/m3
Comment Guidelines
National World encourages reader discussion on our stories. User feedback, insights and back-and-forth exchanges add a rich layer of context to reporting. Please review our Community Guidelines before commenting.