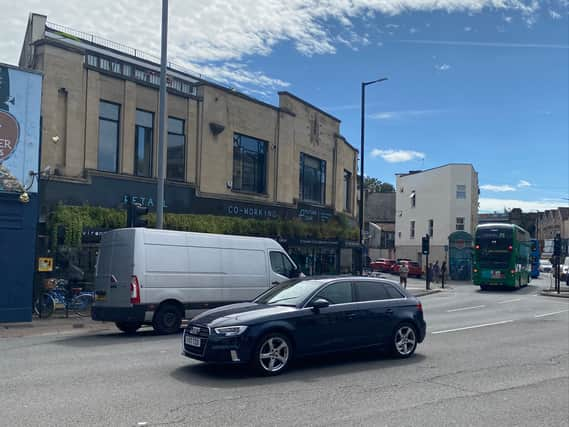
Air pollution increases in several Bristol areas since Clean Air Zone was introduced


Several sites in Bristol saw an increase in air pollution in the year since the Clean Air Zone was introduced.
Air pollution levels have fallen on average across the city by 9.7 per cent, with some areas falling by over 20 per cent - but a few parts of the city have got worse.
Advertisement
Hide AdAdvertisement
Hide AdThe Clean Air Zone was introduced in Bristol in November 2022, to tackle high levels of poisonous air pollutants like nitrogen dioxide, which are emitted by motor vehicles.
A landmark report has now been published evaluating its successes one year on.
Nitrogen dioxide, which contributes to health problems like asthma, lung cancer and heart disease, is measured in many tiny tubes scattered around Bristol.
Each month the diffusion tubes take a reading of nitrogen dioxide, providing scientists with an annual average.
Advertisement
Hide AdAdvertisement
Hide AdMost areas both within the CAZ and outside it saw a reduction in air pollution last year, with an average of 12.6 per cent inside the CAZ and 7.8 per cent outside it.
But according to the evaluation report, a few diffusion tubes actually measured increases in nitrogen dioxide.
Blackboy Hill, at the top of Whiteladies Road near the Downs, saw a whopping increase of 42 per cent.
In 2022 the site was within legal limits for air quality, but last year measured an average of 51.4 micrograms of nitrogen dioxide per cubic metre of air.
Advertisement
Hide AdAdvertisement
Hide AdAccording to the CAZ evaluation report, this is due to changes to a fast food restaurant’s ventilation system.
The Galleries also saw an increase in air pollution — despite being within the CAZ.
Levels of nitrogen dioxide jumped by 20 per cent, with an average of 60.9 micrograms of nitrogen dioxide per cubic metre of air last year.
The report said this was impacted by “non-CAZ related sources” and added that further investigation is needed.
Advertisement
Hide AdAdvertisement
Hide AdIn Bishopston, Bishop Road saw a 4.6 per cent increase and Strathmore Road an 8.3 per cent increase.
One site on Gloucester Road increased by 14.1 per cent, although it’s unclear exactly where this was on the long road going through the north of the city.
In Montpelier, Cheltenham Road and Ashley Road saw an increase of about six per cent.
In Bedminster, one site at Dalby Avenue saw an increase of 16.9 per cent, while another saw a decrease of 16.1 per cent.
Advertisement
Hide AdAdvertisement
Hide AdIn Redland, two sites on Linden Road saw increases of about 2.3 per cent.
In the city centre, one site on Baldwin Street saw an increase of 8.9 per cent, while another decreased by 3.5 per cent.
The High Street north of Bristol Bridge increased by 15.7 per cent.
A roundabout on the A4044 increased by 6.7 per cent, and Victoria Street increased by 4.4 per cent.
Temple Way bridge saw an increase of 6.8 per cent.
Comment Guidelines
National World encourages reader discussion on our stories. User feedback, insights and back-and-forth exchanges add a rich layer of context to reporting. Please review our Community Guidelines before commenting.