
The latest house price data based on Land Registry figures for the year to March 2025 were published by the Office for National Statistic in September.
The new figures have revealed several areas of Bristol were house prices have rapidly fallen in the last year.
The rate at which prices are rising can give an indication of the most up and coming areas of Bristol.
We have compiled the areas in Bristol were prices have risen most from March 2024 to March 2025.
Here are the 19 Bristol neighbourhoods where house prices have increased the most since March 2024 to March 2025.
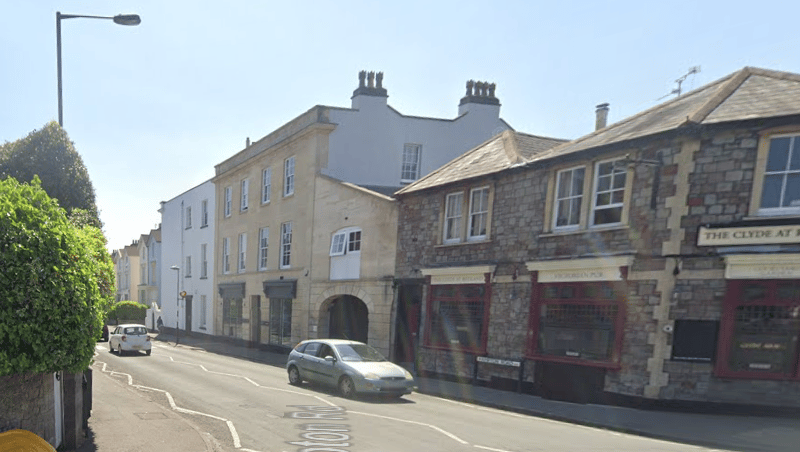
1. Redland and St Andrew's
The average house price in Redland & St Andrew's went up by 25.3% during the year ending in March 2025, to £520,000 | Google Maps
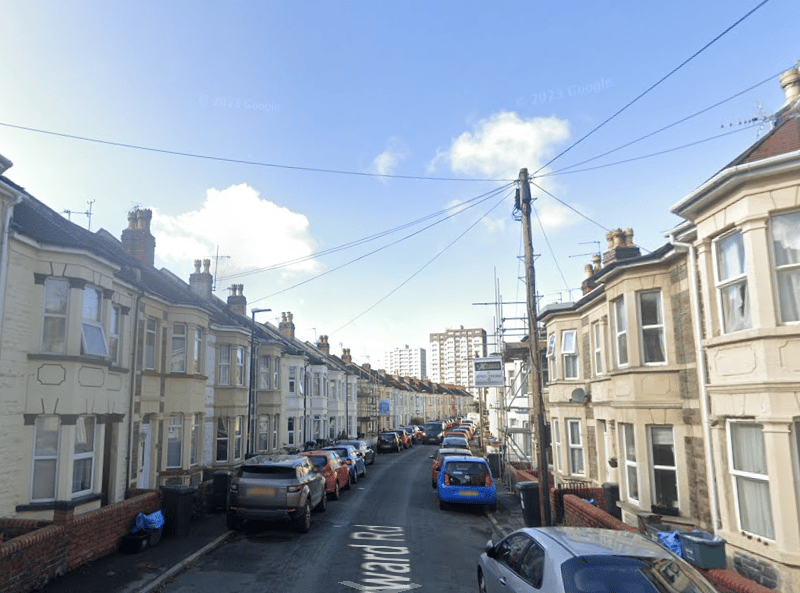
2. Barton Hill
The average house price in Barton Hill went up by 20.99% during the year ending in March 2025, to £294,000 | Google Maps
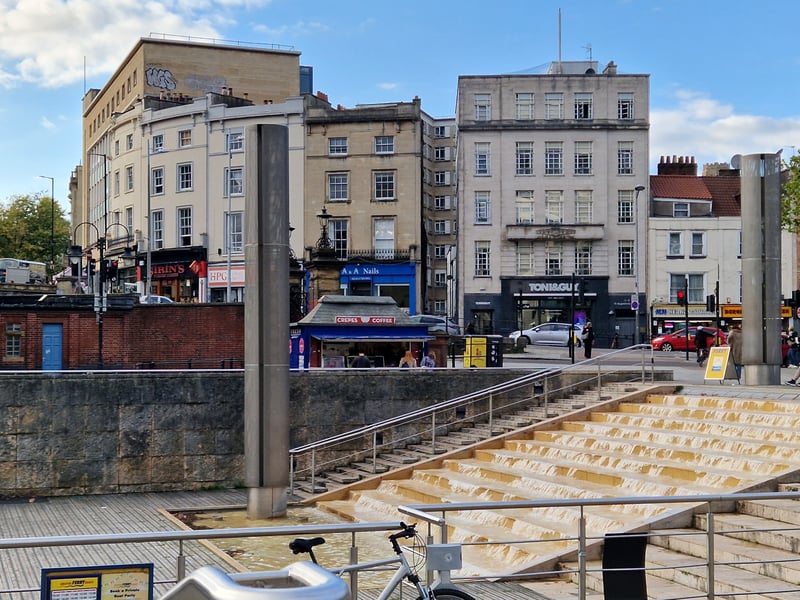
3. City Centre & Harbourside
The average house price in City Centre & Harbourside went up by 10.14% during the year ending in March 2025, to £380,000 | BristolWorld
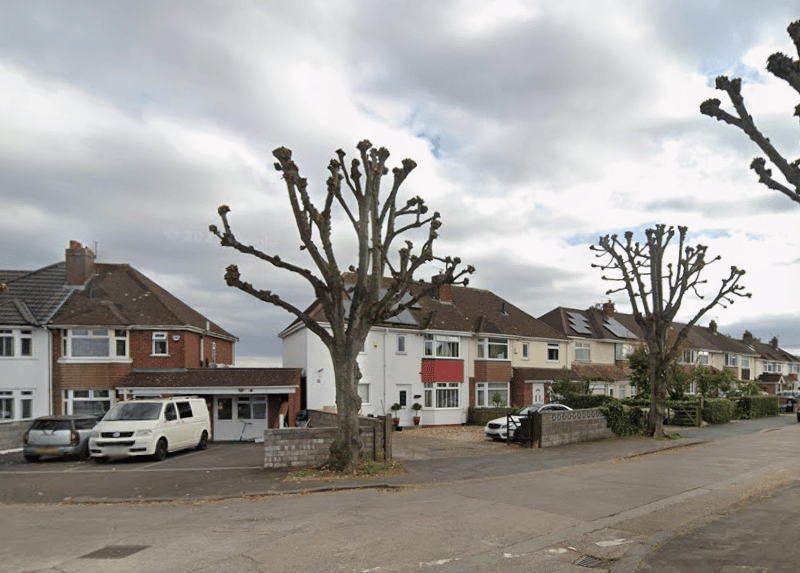
4. Headley Park
The average house price in Headley Park went up by 9.82% during the year ending in March 2025, to £307,500 | Google Maps