
A new study by compare My Move has unveiled the most popular locations to move into in Bristol.
The data was sourced by asking over 2,3000 Bristol movers where they moved over the past year.
The study also includes the average house price and monthly rent of each area and the year-on-year change in movers.
Dave Sayce, co-founder and managing director of Compare My Move, commented on what this data could mean for Bristol movers in 2026: “The data shows that more people are focusing on the most affordable areas to buy and rent.
“This suggests that if you already live in one of Bristol’s more expensive areas, such as Clifton, Horfield or Bedminster, house price growth may slow as demand begins to level off.
“On the other hand, for those living in or moving to areas where demand is rising, it is likely that house prices in these locations will increase in 2026.”
Here are the 10 most popular locations:
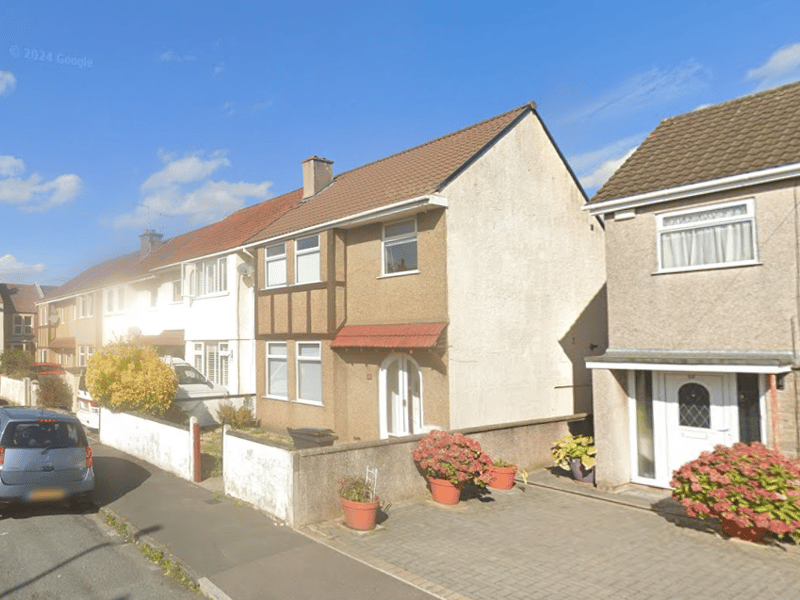
1. Fishponds
Average House Price: £358,023. Average Monthly Rent: £2,495. Percentage of Bristol movers: 8.23%. Year-on-Year Change in Movers: -11.57%. | Google Maps
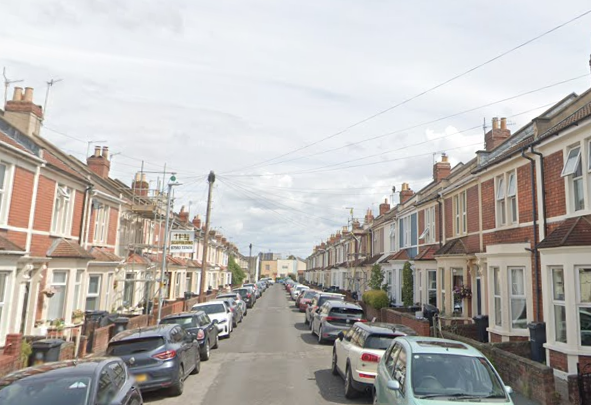
2. Bedminster
Average House Price: £403,112 . Average Monthly Rent: £1,540 . Percentage of Bristol movers: 7.28%. Year-on-Year Change in Movers: -6.63%. | Google Maps
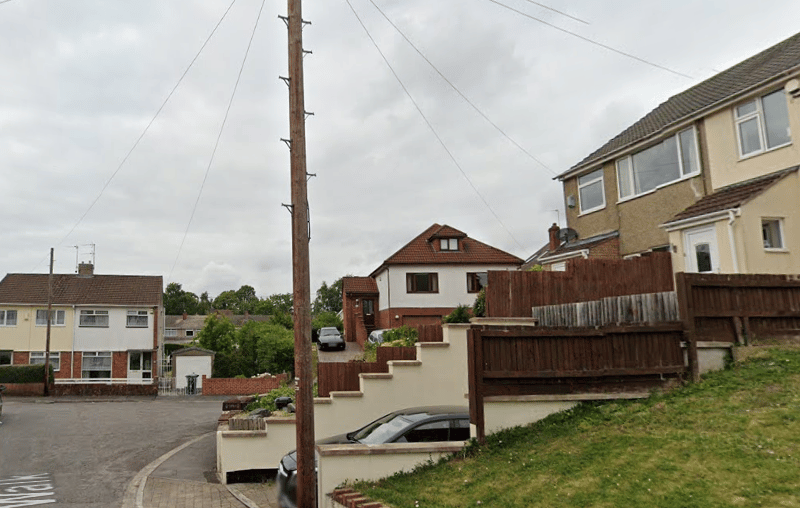
3. Kingswood
Average House Price: £316,597 . Average Monthly Rent: £1,270 . Percentage of Bristol movers: 5.6%. Year-on-Year Change in Movers: 28.71%. | Google Maps
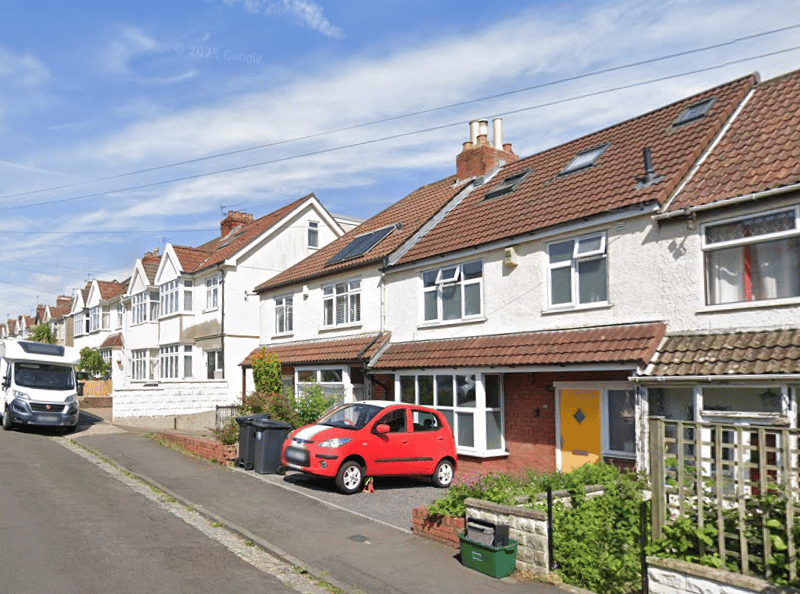
4. Horfield
Average House Price: £477,648 . Average Monthly Rent: £2,845 . Percentage of Bristol movers: 5.43%. Year-on-Year Change in Movers: -3.08%. | Google Maps