
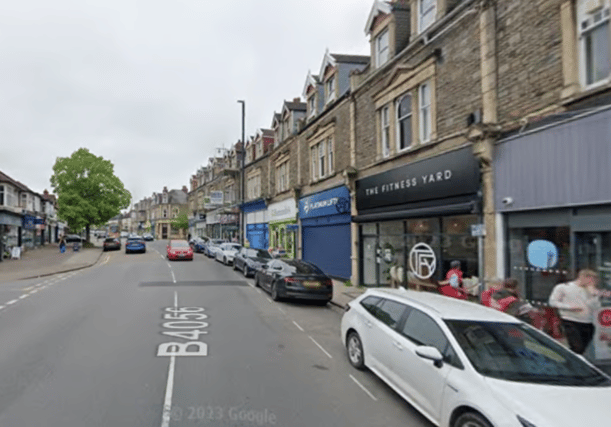

We have identified the areas in Bristol were residents are better off based on average income and house prices.
To establish the rankings, we used the latest house price data based on Land Registry figures for the year to March 2025, which were published by the Office for National Statistic in September.
The was compared net annual income of the middle layer super output areas (MSOAs) for the financial year ending 2023, which was published by Office for National Statistic in December.
Here are the results:
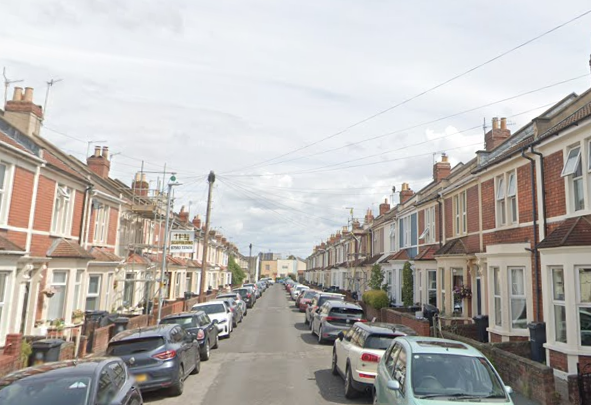
29. Bedminster
On average, residents earn 9 times more (£37,080 ) than the average house price in the area (£321,500 ) | Google Maps
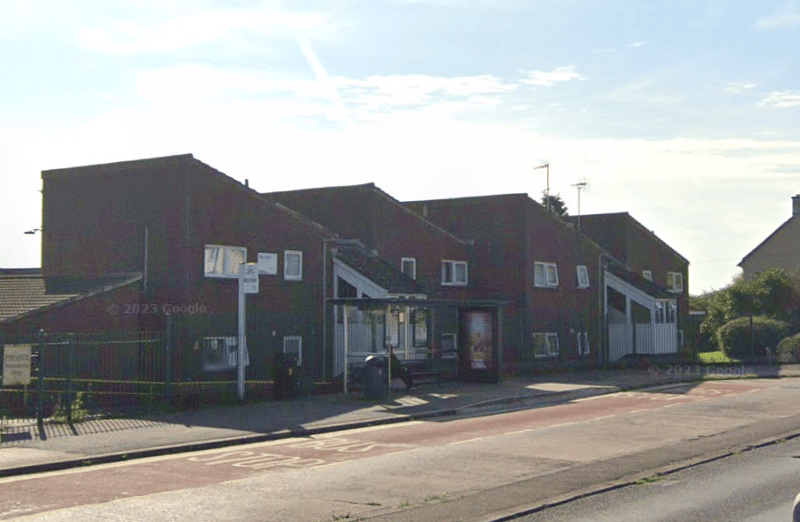
30. Southmead
On average, residents earn 9 times more (£37,230 ) than the average house price in the area (£319,000 ) | Google Maps
8 / 8