
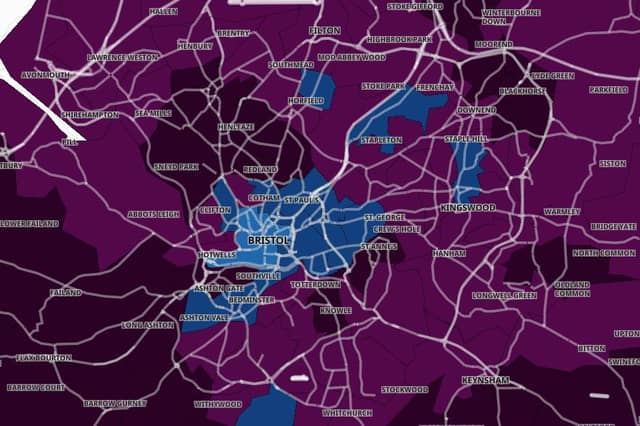

As city leaders call for people to wear facemasks in public, we take a look at rates of cases per 100,000 people in each of the city’s 54 neighbourhoods.
Latest Government figures show there were more than 3,000 new cases in the city in the week up to October 22.
And of the 54 neighbourhoods in the city, 47 saw the rate of infections increase.
The rate of infections across Bristol in the week was 719.9 – a jump from 521 the week before.
Hospitalisations and deaths continue to rise too.
Latest figures show 55 patients were in hospitals run by University Hospitals Bristol and Weston Trust with the virus in the week up to October 26, up from 49 the week before.
There have now also been 556 deaths reported within 28 days of a positive test.
We reveal which neighbourhoods in Bristol saw the biggest rise in case rates per 100,000 people.
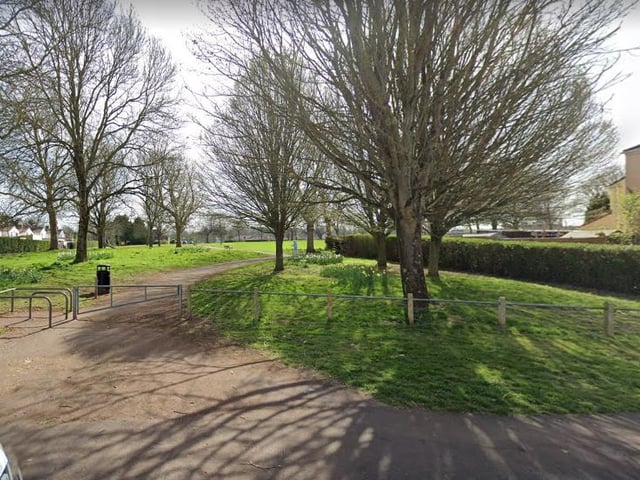
1. St Anne's
St Anne's has seen rates of positive Covid cases rise by 1,162 per cent, from 81cases per 100,000 people to 1,022. Photo: Google Maps
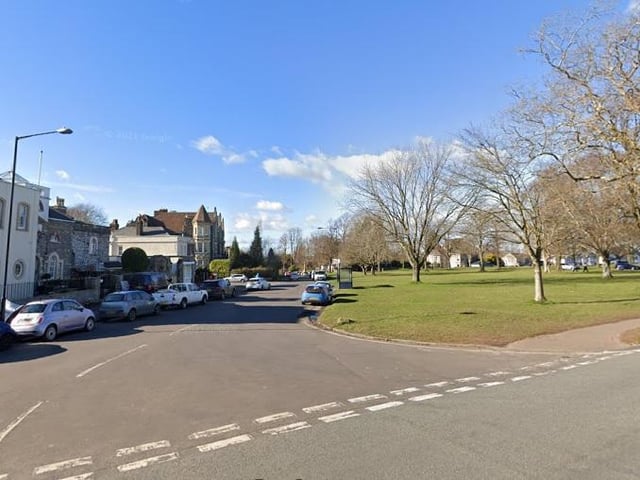
2. Stoke Bishop
Stoke Bishop has seen rates of positive Covid cases rise by 818 per cent, from 118 cases per 100,000 people in the week ending October 8 to 1,085 in the week ending October 15. Photo: Google Maps
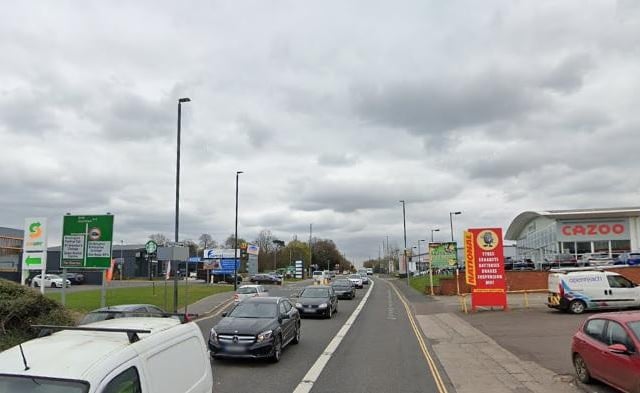
3. Brislington
Brislington has seen rates of positive Covid cases rise by 720 per cent, from 75 cases per 100,000 people in the week ending October 8 to 617 in the week ending October 15. Photo: Google Maps
4. Headley Park
Headley Park has seen rates of positive Covid cases rise by 700 per cent, from 64 cases per 100,000 people in the week ending October 8 to 515 in the week ending October 15. Photo: Google Maps