Covid-19 Bristol: What is the infection rate in my neighbourhood - and the eight worst-hit areas

and live on Freeview channel 276
The Government data comes as the city’s two hospitals declare critical incidents over a rise in Covid admissions and staff shortages.
Advertisement
Hide AdAdvertisement
Hide AdIn response, the city’s Southmead Hospital has been selected to become one of eight ‘Omicron surge hubs’ while visitors have been banned from the Bristol Royal Infirmary.
As of January 6, there were 176 people in the city hospitals unwell with Covid.
The latest weekly data at ward level up to December 30 shows many Bristol neighbourhoods hold infection rates higher than the national average, which stands at 1625.1 cases per 100,000 people.
26 areas did see a drop in infections, though.
Here is an interactive map we have created showing infection rates for each area in Bristol, using latest Government data:
Loading....
Advertisement
Hide AdAdvertisement
Hide AdBristol City Council has the 203rd highest Covid rate out of 381 local authorities at 1,511.8 cases per 100,000 of the population - below the national average.
But the authority says in the week up to January 6, out of almost 24,000 people in the city who had a PCR test, 31% got a positive result.
From Monday (January 11) people who receive positive lateral flow device test results will be required to self-isolate immediately but will no longer be required to take a confirmatory PCR test.
Here are the eight Bristol neighbourhoods with the highest Covid rates.
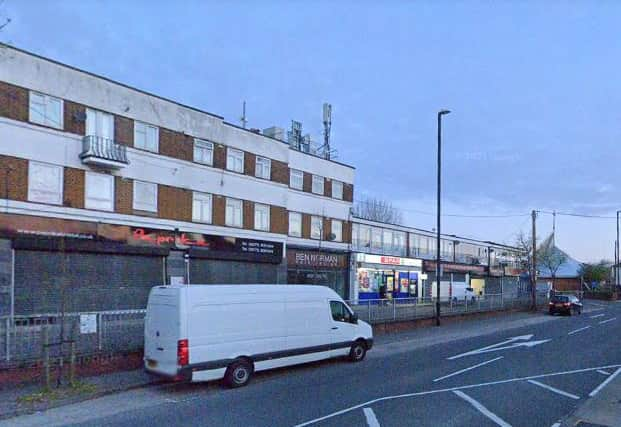
Withywood - 2,230.7
Advertisement
Hide AdAdvertisement
Hide AdWithywood currently has the highest Covid infection rate in Bristol. The area recorded a case rate of 2,230.7 per 100,000 of the population in the week leading to December 30. The week before (week leading to December 23) Withywood recorded a rate of 935.7 per 100,000 of the population, meaning a 149.1% increase.


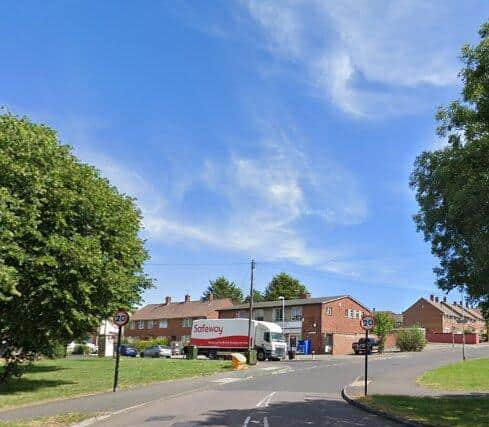
Headley Park - 2,220.8
Headley Park holds the second highest infection rate in Bristol. In the week leading to December 30, the area recorded a case rate of 2,220.8 per 100,000 of the population. The rate was 1,384 the week before (December 23), meaning it jumped by 60%.

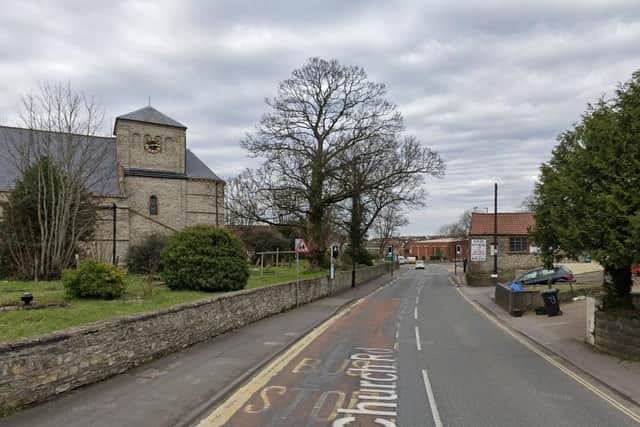
Whitchurch Park - 2,140.0
Whitchurch Park has the third highest infection rate in Bristol. The area recorded a rate of 2,140.0 per 100,000 cases in the week leading up to December 30. It means the rate increased by 82.3% from the week before, when the area recorded a rate of 1,174.
Hartcliffe - 2140.8
Infections rose faster in Hartcliffe than any other Bristol neighbourhood in the week leading up to December 30 - 188.5% after the area recorded 2,140.8 per 100,000 of the population, up from 738.5 the week before.
Bishopsworth - 2,055.4
Advertisement
Hide AdAdvertisement
Hide AdBishopsworth recorded an infection rate of 2,055.4 per 100,000 of the population in the week leading to Decemer 30. The week before (December 23) the area recorded a rate of 1,223, which means infections jumped 68.1% in that week.
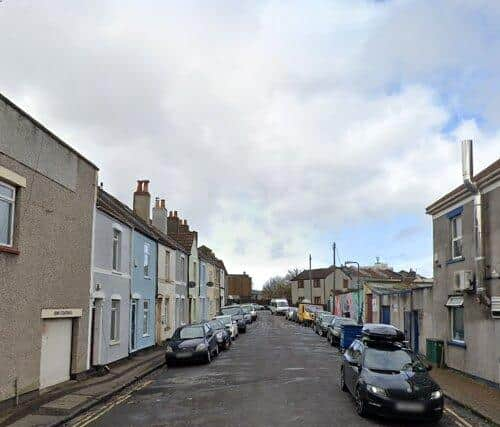
Bedminster - 1,935.7
Bedminster recorded an infection rate of 1,935.7 per 100,000 of the population in the week leading up to December 30. This meant infections increased by 6% as the area had recorded a rate of 1,826.5 the week before.
Knowle West - 1,917.9
Infections jumped by 130.7% in Knowle West after the area recorded an infection rate of 1,917.9 per 100,000 of the population in the week leading to December 30. The week previous, the infection rate was 831.5.

Henbury and Brentry - 1,913.3
Henbury and Brentry recorded an infection rate of 1,913.3 per 100,000 of the population in the week leading to December 30. The week before (December 23) the area recorded a rate of 1,372.8, which means infections jumped 39.4% in that week.
Comment Guidelines
National World encourages reader discussion on our stories. User feedback, insights and back-and-forth exchanges add a rich layer of context to reporting. Please review our Community Guidelines before commenting.